
Αρχείο:Dichloromethane near IR spectrum.png

Μέγεθος αυτής της προεπισκόπησης: 800 × 558 εικονοστοιχεία . Άλλες αναλύσεις: 320 × 223 εικονοστοιχεία | 640 × 446 εικονοστοιχεία | 1.024 × 714 εικονοστοιχεία | 1.280 × 893 εικονοστοιχεία | 2.560 × 1.785 εικονοστοιχεία | 3.500 × 2.441 εικονοστοιχεία.
Εικόνα σε υψηλότερη ανάλυση (3.500 × 2.441 εικονοστοιχεία, μέγεθος αρχείου: 281 KB, τύπος MIME: image/png)
|
|
Αυτό το αρχείο και η περιγραφή του προέρχονται από το Wikimedia Commons. Οι πληροφορίες από την σελίδα περιγραφής του εκεί εμφανίζονται παρακάτω. |
Σύνοψη
| Περιγραφή |
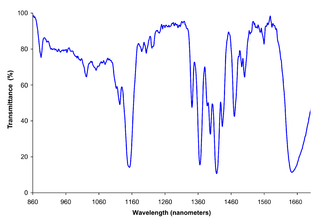
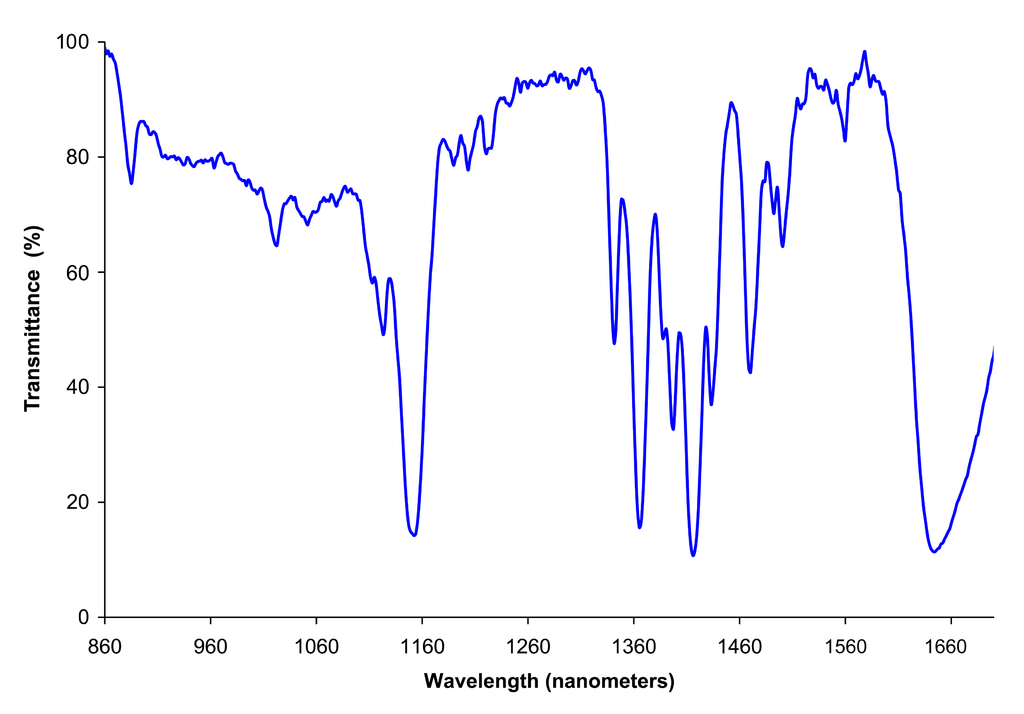
English: Dichloromethane near IR spectrum. I took this spectrum using an Ocean Optics near IR (NIR-512) temperature-regulated InGaAs detector spectrometer [1] with IR fiber optic light guide. This is a very rough spectrum and should not be used for any kind of quantitative data whatsoever. I took it by shining the light from a halogen lightbulb through a tiny (~20ml) beaker of liquid dichloromethane (~2cm liquid optical path) and into the fiber optic of the spectrometer (I subtracted the spectrum of the empty beaker before taking this one). The spectrometer was not really intended to be used this way and it is a very sloppy way to take a spectrum! Nonetheless, based on comparing it to simillarly taken spectra of water and ethanol, I think it likely fairly accurately shows real features of the NIR spectrum of this compound. I normalized the transmittance to 100%. |
| Ημερομηνία | 10 Σεπτεμβρίου 2006 (original upload date) |
| Πηγή | Transferred from en.wikipedia to Commons by Tgr. |
| Δημιουργός | Deglr6328 at Αγγλικά Βικιπαίδεια |

|
This graph image could be re-created using vector graphics as an SVG file. This has several advantages; see Commons:Media for cleanup for more information. If an SVG form of this image is available, please upload it and afterwards replace this template with
{{vector version available|new image name}}.
It is recommended to name the SVG file “Dichloromethane near IR spectrum.svg”—then the template Vector version available (or Vva) does not need the new image name parameter. |
Αδειοδότηση
Deglr6328 from en.wikipedia.org, ο κάτοχος των πνευματικών δικαιωμάτων αυτού του έργου, το δημοσιεύει δια του παρόντος υπό την εξής άδεια χρήσης:
| Το αρχείο διανέμεται υπό την άδεια Creative Commons Αναφορά προέλευσης-Παρόμοια διανομή 3.0 Μη εισαγόμενη Με τους όρους των αποποίηση ευθυνών. | ||
| Απόδοση: Deglr6328 from en.wikipedia.org | ||
| ||
| Αυτή η ετικέτα άδειας χρήσης προστέθηκε στο αρχείο ως μέρους της αναθεώρησης της άδειας GFDL . |

|
Παραχωρείται η άδεια προς αντιγραφή, διανομή και/ή τροποποίηση αυτού του εγγράφου υπό τους όρους της Άδειας Ελεύθερης Τεκμηρίωσης GNU, Έκδοση 1.2 ή οποιασδήποτε νεότερης έκδοσης δημοσιευμένης από το Ίδρυμα Ελεύθερου Λογισμικού· χωρίς Απαράλαχτους Τομείς, χωρίς Κείμενα Εξωφύλλου, και χωρίς Κείμενα Οπισθοφύλλου. Αντίγραφο της άδειας περιλαμβάνεται στην σελίδα με τίτλο GNU Free Documentation License. Με τους όρους των αποποίηση ευθυνών. |
Καταγραφές ανεβασμάτων πρωτότυπου αρχείου
The original description page was here. All following user names refer to en.wikipedia.
- 2006-09-16 23:30 Deglr6328 3500×2441×8 (387879 bytes) transmittance
- 2006-09-10 01:02 Deglr6328 3500×2441×8 (385954 bytes) oops. missing numbers
- 2006-09-10 00:54 Deglr6328 3500×2441×8 (432400 bytes) Dichloromethane near IR spectrum. I took this spectrum using an Ocean Optics HR4000 spectrometer [http://www.oceanoptics.com/] with IR fiber optic light guide. This is a very rough spectrum and should not be used for any kind of quantitative data whatsoev
Ιστορικό αρχείου
Κλικάρετε σε μια ημερομηνία/ώρα για να δείτε το αρχείο όπως εμφανιζόταν εκείνη τη στιγμή.
| Ώρα/Ημερομ. | Μικρογραφία | Διαστάσεις | Χρήστης | Σχόλια | |
|---|---|---|---|---|---|
| τελευταία | 17:00, 31 Μαΐου 2015 | | 3.500 × 2.441 (281 KB) | Cmdrjameson | Compressed with pngout. Reduced by 97kB (25% decrease). |
| 11:13, 29 Φεβρουαρίου 2008 |  | 3.500 × 2.441 (379 KB) | File Upload Bot (Magnus Manske) | {{BotMoveToCommons|en.wikipedia}} {{Information |Description={{en|Dichloromethane near IR spectrum. I took this spectrum using an Ocean Optics near IR (NIR-512) temperature-regulated InGaAs detector spectrometer [http://www.oceanoptics.com/] with IR fibe |
Συνδέσεις αρχείου
Τα παρακάτω λήμματα συνδέουν σε αυτό το αρχείο:
Καθολική χρήση αρχείου
Τα ακόλουθα άλλα wiki χρησιμοποιούν αυτό το αρχείο:
- Χρήση σε af.wikipedia.org
- Χρήση σε ar.wikipedia.org
- Χρήση σε az.wikipedia.org
- Χρήση σε bn.wikipedia.org
- Χρήση σε ca.wikipedia.org
- Χρήση σε de.wikipedia.org
- Χρήση σε en.wikipedia.org
- Χρήση σε en.wikibooks.org
- Χρήση σε fi.wikipedia.org
- Χρήση σε hu.wikipedia.org
- Χρήση σε id.wikipedia.org
- Χρήση σε ko.wikipedia.org
- Χρήση σε pt.wikipedia.org
- Χρήση σε ru.wikipedia.org
- Χρήση σε uz.wikipedia.org
- Χρήση σε vi.wikipedia.org