Αρχείο:1880- Global surface temperature - heat map animation - NASA SVS.webm

Τα περιεχόμενα της σελίδας δεν υποστηρίζονται σε άλλες γλώσσες.
Αυτό το αρχείο προέρχεται από το Wikimedia Commons
Από τη Βικιπαίδεια, την ελεύθερη εγκυκλοπαίδεια

Εικόνα σε υψηλότερη ανάλυση(Αρχείο ήχου/βίντεο WebM, VP9/Opus, διάρκεια 30 s, 1.920×1.080 pixels, 1,03 Mbps ολικά, μέγεθος αρχείου: 3,67 MB)

Σύνοψη

Περιγραφή
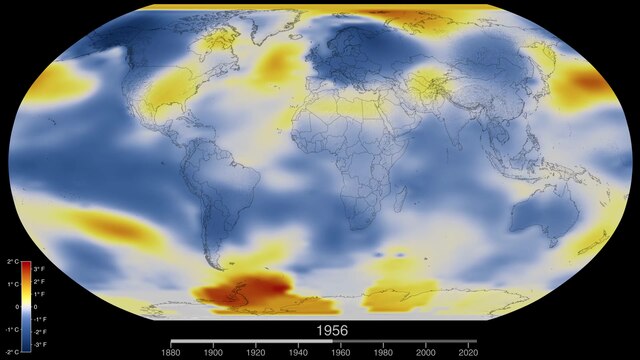
English: Global surface temperature heat map animation for 1880—___. Produced by NASA's Scientific Visualization Studio (SVS) from data from NASA's Goddard Institute for Space Studies.
  • Direct links to source are provided in "Source" box below.

Version 4+5 (data though 2021)

Original source page, titled "Global Temperature Anomalies from 1880 to 2021" Visualizations by Lori Perkins, includes the descriptions:

  • This color-coded map in Robinson projection displays a progression of changing global surface temperature anomalies. Normal temperatures are shown in white. Higher than normal temperatures are shown in red and lower than normal temperatures are shown in blue. Normal temperatures are calculated over the 30 year baseline period 1951-1980. The final frame represents the 5 year global temperature anomalies from 2017-2021. Scale in degrees Celsius.

Version 3 (data though 2020)

Original source page, titled "Global Temperature Anomalies from 1880 to 2020" Visualizations by Lori Perkins, includes the descriptions:

  • This color-coded map in Robinson projection displays a progression of changing global surface temperature anomalies. Normal temperatures are the average over the 30 year baseline period 1951-1980. Higher than normal temperatures are shown in red and lower than normal temperatures are shown in blue. The final frame represents the 5 year global temperature anomalies from 2016-2020. Scale in degrees Celsius.
  • NASA’s full surface temperature data set – and the complete methodology used to make the temperature calculation – are available at: https://data.giss.nasa.gov/gistemp

Version 2 (data though 2019)

Original source page, titled "Global Temperature Anomalies from 1880 to 2019" Visualizations by Lori Perkins, includes the descriptions:

  • "This color-coded map in Robinson projection displays a progression of changing global surface temperature anomalies. Normal temperatures are the average over the 30 year baseline period 1951-1980. Higher than normal temperatures are shown in red and lower than normal temperatures are shown in blue. The final frame represents the 5 year global temperature anomalies from 2015-2019. Scale in degrees Celsius."
  • "These calculations produce the global average temperature deviations from the baseline period of 1951 to 1980."
  • "NASA’s full 2019 surface temperature data set and the complete methodology used for the temperature calculation and its uncertainties are available at: https://data.giss.nasa.gov/gistemp

Version 1 (data through 2018)

Original source page, titled "Global Temperature Anomalies from 1880 to 2018", includes the descriptions:

  • "This color-coded map in Robinson projection displays a progression of changing global surface temperature anomalies from 1880 through 2018. Higher than normal temperatures are shown in red and lower then normal temperatures are shown in blue. The final frame represents the global temperatures 5-year averaged from 2014 through 2018. Scale in degree Celsius."
  • "These calculations produce the global average temperature deviations from the baseline period of 1951 to 1980."
  • "NASA’s full 2018 surface temperature data set — and the complete methodology used to make the temperature calculation — are available at: https://data.giss.nasa.gov/gistemp".
Ημερομηνία
  • 2022-01-13 (Version 4)
  • 2021-01-14 (Version 3)
  • 2020-01-15 (Version 2)
  • 2019-02-06 (Version 1)
Πηγή
Δημιουργός NASA attribution: "Visualizations by Lori Perkins"

Αδειοδότηση

Public domain Αυτό το αρχείο είναι κοινό κτήμα γιατί δημιουργήθηκε από την NASA. Η πολιτική πνευματικής ιδιοκτησίας της NASA δηλώνει ότι «Το υλικό της NASA δεν προστατεύεται από copyright εκτός αν αναφέρεται». (Σελίδα με την πολιτική πνευματικής ιδιοκτησίας της NASA ή Πολιτική Χρήσης Εικόνων του JPL).
Προσοχή:
  • Η χρήση των λογότυπων της NASA, των εμβλημάτων και των διακριτικών της, περιορίζεται από τον αμερικάνικο νόμο 14 CFR 1221.
  • Ο ιστότοπος της NASA έχει μεγάλο αριθμό εικόνων από το Σοβιετικό διαστημικό πρόγραμμα και την Ρωσική Διαστημική Υπηρεσία καθώς και άλλες μη αμερικανικές διαστημικές υπηρεσίες. Αυτού του είδους οι εικόνες δεν είναι κατ' ανάγκην κοινά κτήματα.
  • Υλικό από το διαστημικό τηλεσκόπιο Hubble ενδέχεται να έχει πνευματικά δικαιώματα αν δεν προέρχεται ρητά από το STScI. [1]
  • Όλο το υλικό από την διαστημοσυσκευή SOHO έχει πνευματικά δικαιώματα και απαιτείται άδεια για εμπορική μη εκπαιδευτική χρήση. [2]
  • Οι εικόνες που προβάλλονται στον ιστότοπο Astronomy Picture of the Day (APOD) ενδέχεται να έχουν πνευματικά δικαιώματα [3]

Λεζάντες

Δεν ορίστηκε λεζάντα
Global surface temperature heat map animation for 1880-

checksum Αγγλικά

b142ed559b0cf57c90e5ee219a1897e09896489b

data size Αγγλικά

3.851.008 Byte

30,054 δευτερόλεπτο

1.080 εικονοστοιχείο

1.920 εικονοστοιχείο

Ιστορικό αρχείου

Κλικάρετε σε μια ημερομηνία/ώρα για να δείτε το αρχείο όπως εμφανιζόταν εκείνη τη στιγμή.

Ώρα/Ημερομ.ΜικρογραφίαΔιαστάσειςΧρήστηςΣχόλια
τελευταία06:08, 12 Σεπτεμβρίου 202230 s, 1.920 × 1.080 (3,67 MB)RCraig09D'oh! Now uploading video with CELSIUS color scale
05:46, 12 Σεπτεμβρίου 202230 s, 1.920 × 1.080 (4,84 MB)RCraig09Version 4: updated to include data through 2021
13:27, 11 Ιουλίου 202130 s, 1.920 × 1.080 (6,65 MB)RCraig09Version 3: Update to include 2020 data, as published by NASA in January 2021
05:03, 21 Απριλίου 202033 s, 1.920 × 1.080 (2,67 MB)RCraig09Version 2: NASA video updated with 2019 data.
20:51, 21 Σεπτεμβρίου 201933 s, 1.920 × 1.080 (3,15 MB)RCraig09User created page with UploadWizard

Τα παρακάτω λήμματα συνδέουν σε αυτό το αρχείο:

Καθολική χρήση αρχείου

Μεταδεδομένα